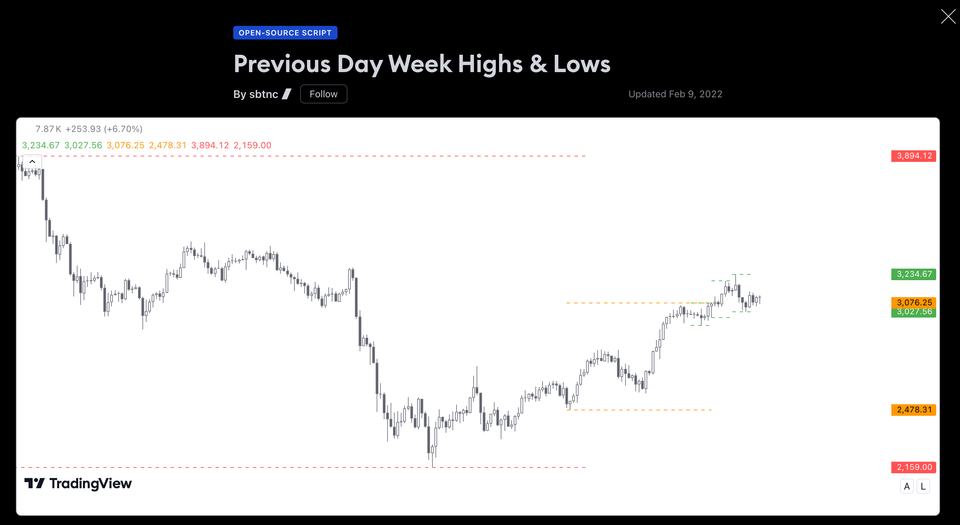
Previous Day Week Highs and Lows Indicator (Trading View)
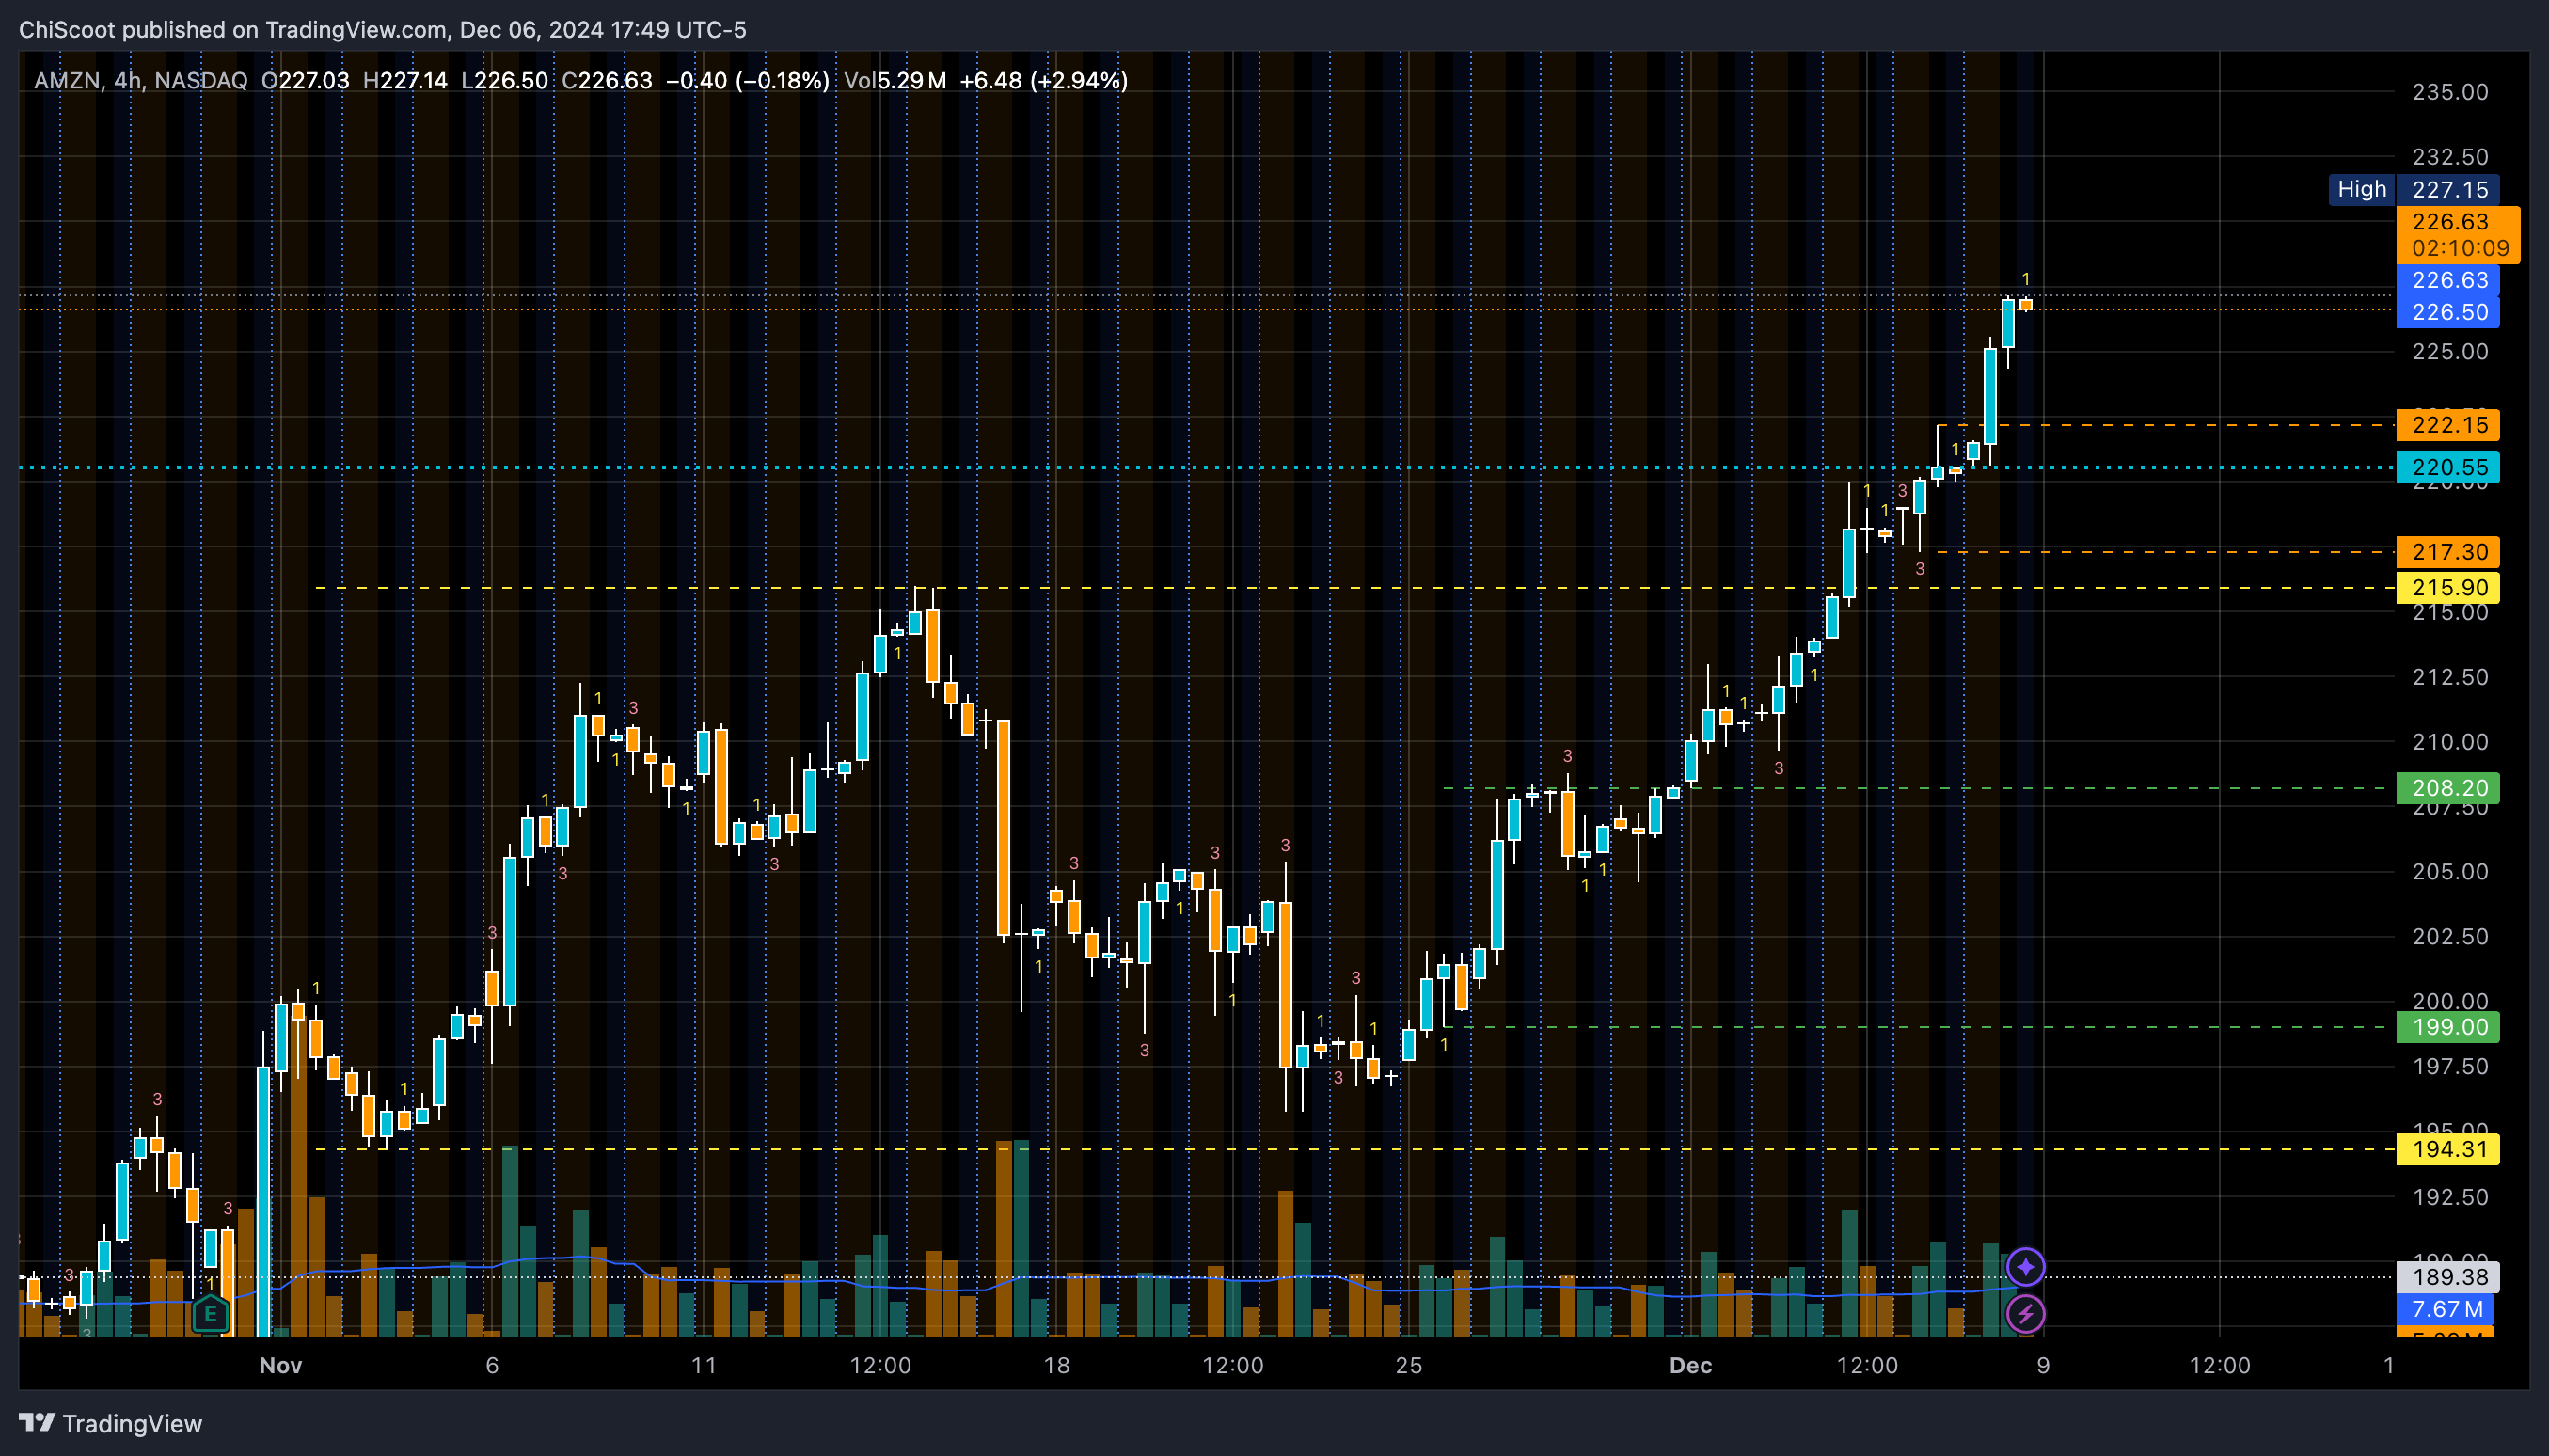
Hello Traders, I am a big fan of key levels in the price chart. Those includes the high and lows of the monthly, weekly, and daily intervals. I'll talk about the importance of why I do this on a different post.
Before coming across this indicator, I used to manually mark the high and lows of those intervals in the price charts of each securities in my watch list. I start with the monthly, then the weekly, and the daily. You can imagine how tedious this can be.
If you're using Trading View, let me save you the time by introducing the Previous Day Week Highs and Lows indicator. It's a pretty smooth process as adding another indicator in your price chart in TV.
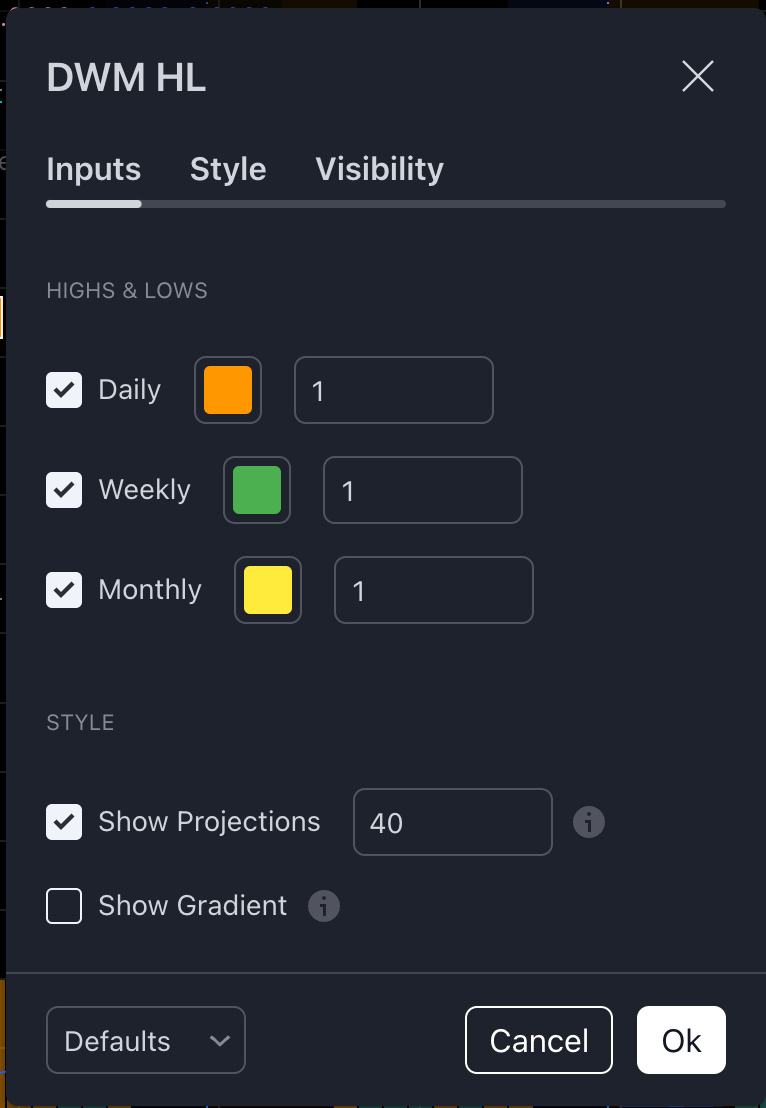
Here's what my settings look like. Give it a go if you like to save time. Cheers.
I am not a professional investment adviser and my opinions are based on my own technical analysis. Please consult an investment professional before making investment decisions.
Do your due diligence if or when placing a trade. All ideas stated here are my own and do not represent trading or investment advice.
Member discussion