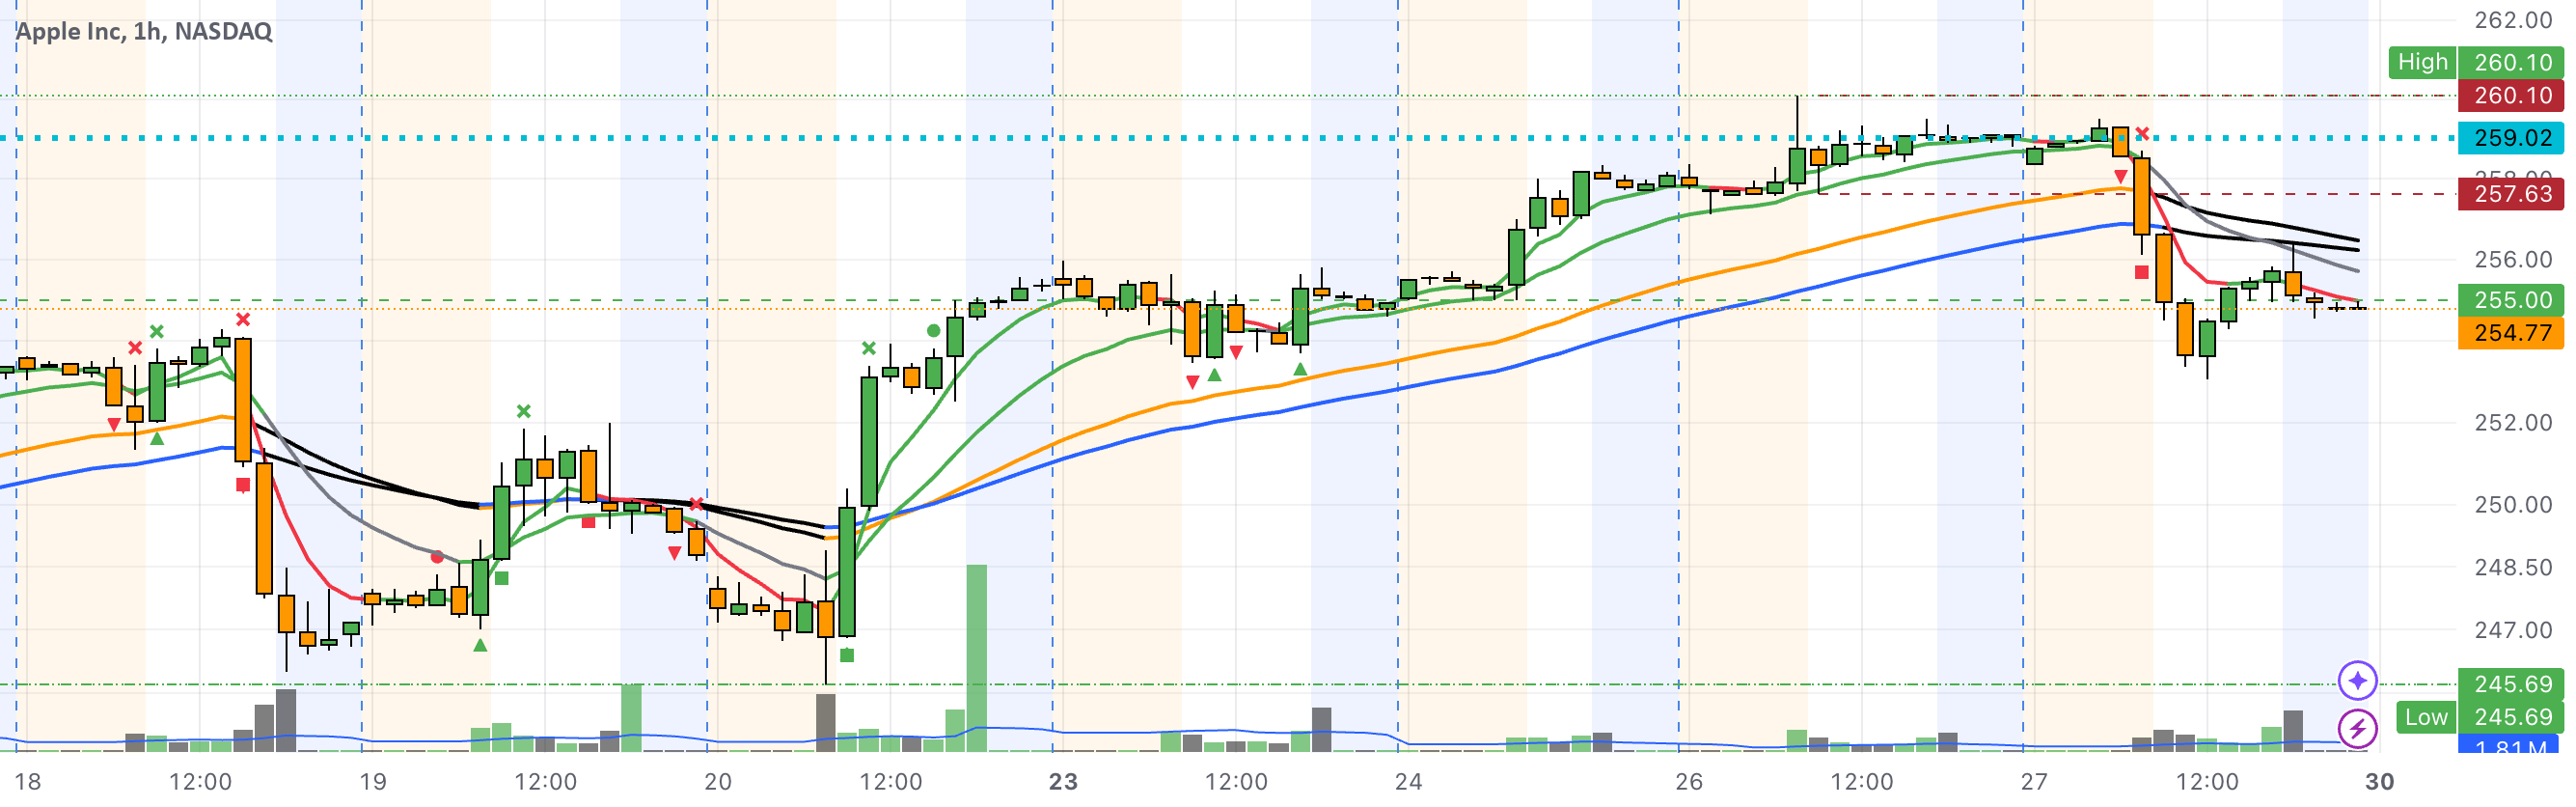
My own EMA CrossOver Indicator (Trading View) - EMA X Over
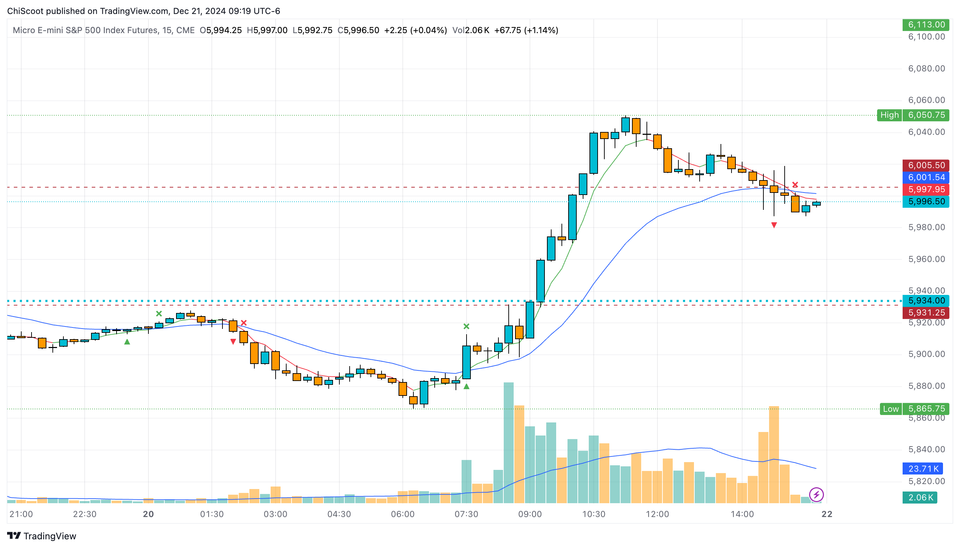
To maintain a visually organized chart, I employ a simple strategy. I utilize only two exponential moving averages (EMAs): the five-period and twenty-period EMA.
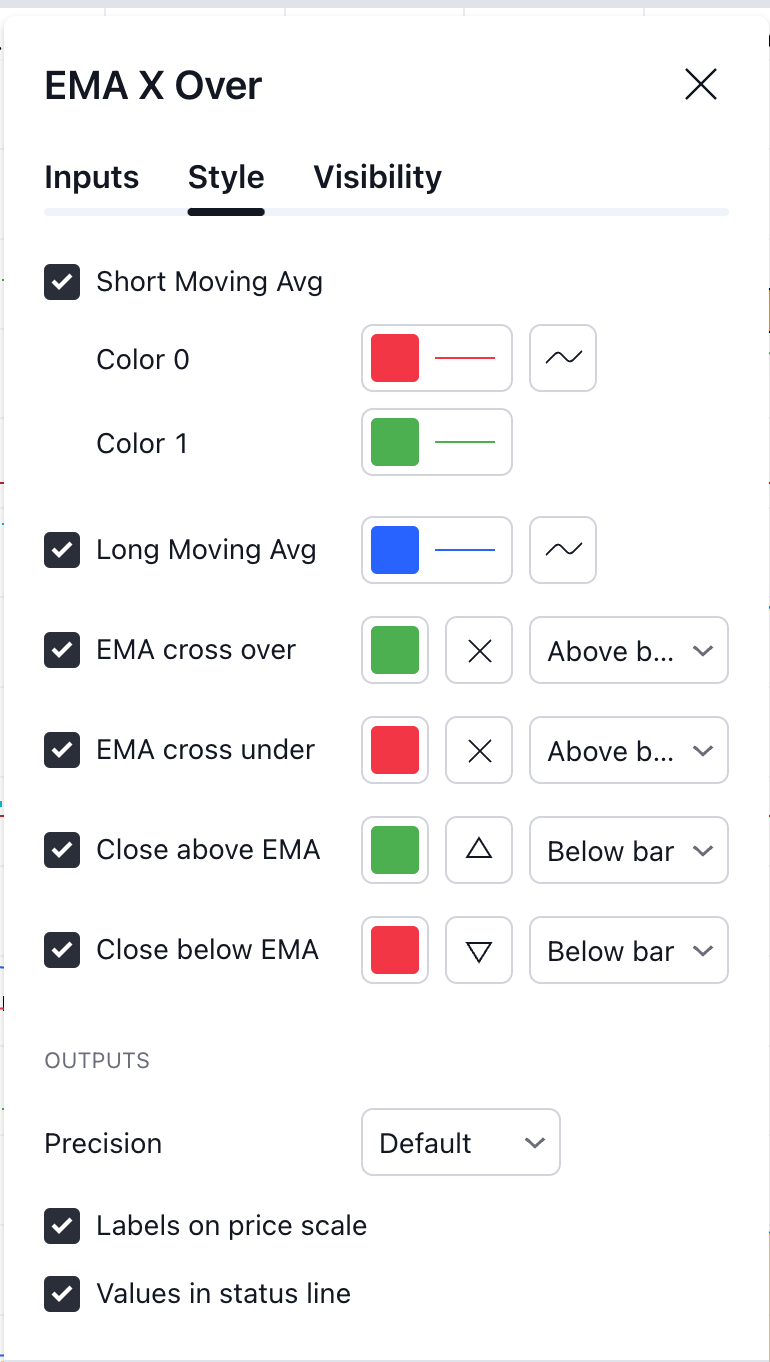
I have developed a straightforward indicator that plots these two EMA values. Additionally, I incorporate a bar marker to indicate a crossover between the two EMA lines. Furthermore, the color of the short average changes when the price exceeds or falls below it.
Finally, a bar marker is displayed when the price closes above or below the long average.
EMA X Over — Indicator by ChiScoot — TradingView
A simple indicator that plots two exponential moving averages (EMAs). Upon a cross between the two EMAs, the chart will display a customizable marker. This marker may signal a change in direction of the price. When a cross happened, wait for both EMAs to go in the same direction. The EMAs will both be in the same color when this happened. When both EMAs are in the same color, look for the established trend. Furthermore, when the price closes above or below the long EMA, the chart will also …
Settings:
Don’t trade what you believe should be happening, only trade what is happening even if it seems impossible.
— Al Brooks
Member discussion